
In 2016, we published the infographic “Diversity in Children’s Books 2015.” It went viral and was discussed on Twitter, in Facebook groups, published in books and journals, and presented at countless conferences.
Today we present to you an updated infographic, “Diversity in Children’s Books 2018.”
 Link to JPG & PDF files: Diversity in Children’s Books 2018 – Dropbox Folder
Full citation: Huyck, David and Sarah Park Dahlen. (2019 June 19). Diversity in Children’s Books 2018. sarahpark.com blog. Created in consultation with Edith Campbell, Molly Beth Griffin, K. T. Horning, Debbie Reese, Ebony Elizabeth Thomas, and Madeline Tyner, with statistics compiled by the Cooperative Children’s Book Center, School of Education, University of Wisconsin-Madison: https://ccbc.education.wisc.edu/literature-resources/ccbc-diversity-statistics/books-by-about-poc-fnn/. Retrieved from https://readingspark.wordpress.com/2019/06/19/picture-this-diversity-in-childrens-books-2018-infographic/.
Released for use under a Creative Commons Attribution-ShareAlike 4.0 International (CC BY-SA 4.0 license). You are free to use this infographic in any of your work, including presentations and published work, so long as you provide the full citation noted above.
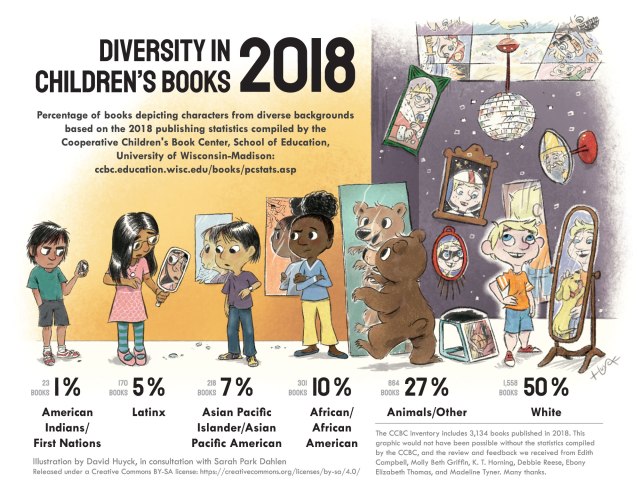
As with the 2015 infographic, we relied on the multicultural publishing statistics compiled by the librarians at the University of Wisconsin-Madison School of Education Cooperative Children’s Book Center (CCBC) that were “about” particular populations: American Indian/First Nation, Latinx, African/African American, and Asian Pacific Islander/Asian Pacific American.
One important distinction between the 2015 and 2018 infographics is that we made a deliberate decision to crack a section of the children’s mirrors (Rudine Sims Bishop, “Mirrors, Windows, and Sliding Glass Doors,” 1990) to indicate what Debbie Reese calls “funhouse mirrors” and Ebony Elizabeth Thomas calls “distorted funhouse mirrors of the self.” Children’s literature continues to misrepresent underrepresented communities, and we wanted this infographic to show not just the low quantity of existing literature, but also the inaccuracy and uneven quality of some of those books.
Similar to the 2015 infographic, David created this with a Creative Commons BY-SA 4.0 license so that anyone working toward equity in children’s literature publishing may freely use it. We hope that this infographic, along with Lee & Low’s Diversity Gap blog posts, Emily Midkiff’s CCBC data graphs, Debbie Reese’s blog American Indians in Children’s Literature, Edith Campbell and Zetta Elliott’s blogs, Maya Christina Gonzalez’ “Children’s Books as a Radical Act” blog posts, Malinda Lo’s LGTBQ blog posts, We Need Diverse Books, Reading While White, Research on Diversity in Youth Literature, and other diversity initiatives, can help push forward important conversations and lead to real change in children’s literature publishing. We encourage you to study these and other sources to better understand the context in which these numbers exist.
Thank you.
Sarah Park Dahlen, Associate Professor, MLIS Program at St. Catherine University
http://sarahpark.com/
@readingspark
David Huyck, Illustrator
davidhuyck.com/
@huyckd
With special thanks to Edith Campbell, Molly Beth Griffin, K.T. Horning, Debbie Reese, Ebony Elizabeth Thomas, and Madeline Tyner.
Note: When I published this blog post in June, I failed to cite Rudine Sims Bishop’s seminal article “Mirrors, Windows, and Sliding Glass Doors,” which is clearly the basis for the mirror metaphor in both the 2018 and the 2015 infographics. We’ve spoken about Sims Bishop in interviews, etc., and cited her on the infographic postcard, but realized we didn’t cite her here. In keeping with #CiteWomen and #CiteBlackWomen, I have added her name in the blog post above. I also added a link to Emily Midkiff’s very useful graphs in the last paragraph. With apologies for these omissions, Sarah (updated on 2019 Oct 23)

This is wonderful! Thank you for making the infographic available for sharing. As a school librarian in an early elementary setting, I am curious to see how my recent and future acquisitions align with your data. I hope to remain mindful of the cracks and distortions in the mirrors and prisms among our books, and your infographic will keep me on task.
This is an excellent reminder that children need books that have characters they can relate to. As a teacher in a primarily Hispanic community, I noticed that years ago. So when I went to write a middle grade fantasy I made sure that she was Hispanic. I have read my published Forest Secrets with my students who love the references to menudo, quinceaneras, comadres, etc. We can honor diverse cultures and create fun adventures at the same time.
Reblogged this on Laurie Woodward and commented:
Let’s continue to strive for books with characters our children can relate to.
There are some fundamental problems with the infographic, but the biggest is that CCBC specifically does NOT count books with unclued brown-skinned characters in these statistics, no matter how brown-skinned they are.
As currently noted on the CCBC website addressing how the count is made, “Similarly we were once likely to count a book with a brown-skinned child, most often as African American, whereas now we track books with brown-skinned characters in which there are no apparent clues of the characters’ specific race or ethnicity, but we do not count them as part of these statistics.” This is true even though the CCBC has noted a burgeoning number of these kinds of books (see K.T. Horning’s interview at Hornbook on March 17, 2017).
Can we at least note on the infographic how many books like this there are? CCBC has the information; it’s the simplest revision to make.
Thank you for the suggestion. The CCBC librarians and I discussed the many different ways we might figure out the data; in the end, we decided it would be simplest to use the same data they used for a different infographic they had made earlier this year. Otherwise, we’d have to do a lot more work to figure out all the data. As well, we’ve received a lot of questions for clarification over the past 2 days and will take these into consideration if/when we create a new infographic. We do not have the space on the current infographic to add all these footnotes, but they are part of the record on Twitter and here in my comments. As you mentioned, here’s a link to KT Horning’s interview: https://www.hbook.com/2017/03/choosing-books/horn-book-magazine/the-ccbcs-diversity-statistics-a-conversation-with-kathleen-t-horning/
Thank you for your response. It is a sad and discouraging message to send to authors and illustrators about their characters, as well as to parents and children who are clearly non-white but do not identify with a particular racial group. The message is, we know you are out there, we even know how many of you there are, but we are not going to count you in representation because you do not fit into our essentialist categories.
Thank you both for this work!
What I notice comparing 2018 and 2015: While books about white kids have dropped 23% and books about BIPOC have made small gains, books with animals and other non-human characters have more than doubled. We need better than that!
Pingback: Diversity in Children’s Books 2018 Infographic | OYAN - Oregon Young Adult Network
Thank you both for compiling this information and sharing it/graphic with us. As a Japanese American author who grew up without any books that had any characters that looked like me, I had hoped we would be further along. It really shows how much #OwnVoices matter and are needed. Adding the cracked and distorted mirrors, reflecting the quality of the books is eye opening. I’m very grateful for all the work done by the sources listed here.
Excellent work, thank you.
Thank for all this work. I have a couple of related factual questions. CCBC in March of this year (with an update on May 14) reported in a chart receiving and analyzing 3320 books from American publishers alone (link below). This infographic accounts for 3,134 books. What happened to the other 200 books? The CCBC in the same chart also reports 390 books from American publishers about Africans or African-Americans, but the infographic reports only 301, a nearly 30% decrease. Again, what happened?
https://ccbc.education.wisc.edu/books/pcstats.asp#USonly
Thanks for the question. The CCBC librarians and I discussed the many different ways we might figure out the data; in the end, we decided it would be simplest to use the same data they used for a different infographic they had made earlier this year. They could better answer your question re: the specific numbers.
Thanks Sarah and David! This infographic will come in handy for my upcoming lecture on post-structuralist approaches to inclusion in the classroom – i.e. educators need to focus on classroom discourses and examine what message their classroom texts are sending about inclusion…