
Thank you.
We are blown away by the response to our CCBC infographic. Many have long been advocating for diversity in children’s literature; as we’d hoped, this infographic is pushing this work along. Since September 14, the blog post has had over 36,000 views; my initial tweet made over 17,000 impressions; my Facebook post was shared over 10,000 times, including by writers Cynthia Leitich Smith, Zetta Elliott, Mike Jung, Ellen Oh, and Junot Díaz. Professors, teachers, librarians, and students – from K-12 through graduate courses at universities and public libraries across the US and the world – are printing, sharing, displaying, and discussing the infographic.
Of course, with so much visibility came many questions.
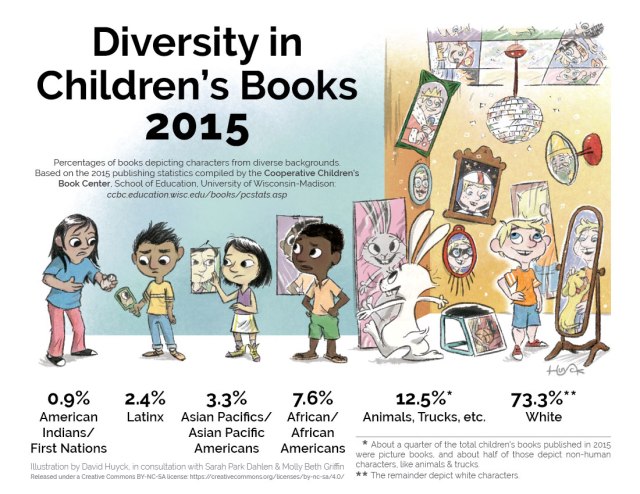
Sarah Hannah Gómez pointed out the difference between the white category in the 2012 infographic, and ours, which uses data from 2015. She noted that it may cause folks to think we have made progress. But actually, David included the bunny to show that a significant percentage of children’s literature depicts animals and inanimate objects (trucks, cupcakes, screws, etc.) as protagonists, something CCBC Director KT Horning wrote about in her 2013 blog post “I See White People.” The 2012 infographic, created prior to Horning’s 2013 post, does not reflect this, so the numbers are not exactly aligned.
Many people wondered about categorization. Where are South Asians? Why are Pacific Islanders included with Asians? Where are Jewish people? etc. Categorizing people (and books) into groups is difficult work. After some discussion, we decided to use pretty much the same category titles as the CCBC; you can read more on their website about how they categorize.
The CCBC’s data includes distinct categories for books by, and for books about, each of the demographics they count. The about category may, or may not, include a book in the by category (this happens when an Asian American writer, for example, writes a book that is not about Asian Americans.) For our infographic, we used only the about data. It is vitally important to note that this data does not reflect the quality, accuracy, etc. of the books themselves. It is also vitally important to to note that the number of books about and written and illustrated by #OwnVoices authors is significantly lower.
Our hope is that people will continue to ask questions and do the work that will uncover more information. See Debbie Reese’s post “A Close Look at CCBC’s 2015 Data on Books By/About Americans Indians/First Nations” for one example of how a scholar unpacked the data, and Jerrold Connors’ post “We Need Diverse Books, and How!” for some more graphs. As many have done with our infographic, read everything critically. Who is saying what? What is left unsaid? What more needs to be done?
In short, we still have much work to do.
Note: We made the infographic with a Creative Commons BY-NC-SA 4.0 license, so you may download a JPF and PDF here.
Recommended citation: Huyck, David, Sarah Park Dahlen, Molly Beth Griffin. (2016 September 14). Diversity in Children’s Books 2015 infographic. sarahpark.com blog. Retrieved from https://readingspark.wordpress.com/2016/09/14/picture-this-reflecting-diversity-in-childrens-book-publishing/

Pingback: Beyond Windows and Mirrors – Creating Space and Connections in Narrative – Kai Stephanson
Pingback: Kids' books for change calls attention to bias where we may not expect it